01
Image Processing
Raw pixels are filtered, enhanced, denoised, and prepared for higher-level analysis.
עופר מילר : אתר פרסומי המחקר הרשמיים
עופר מילר : אתר פרסומי המחקר הרשמיים
עופר מילר : אתר פרסומי המחקר הרשמיים
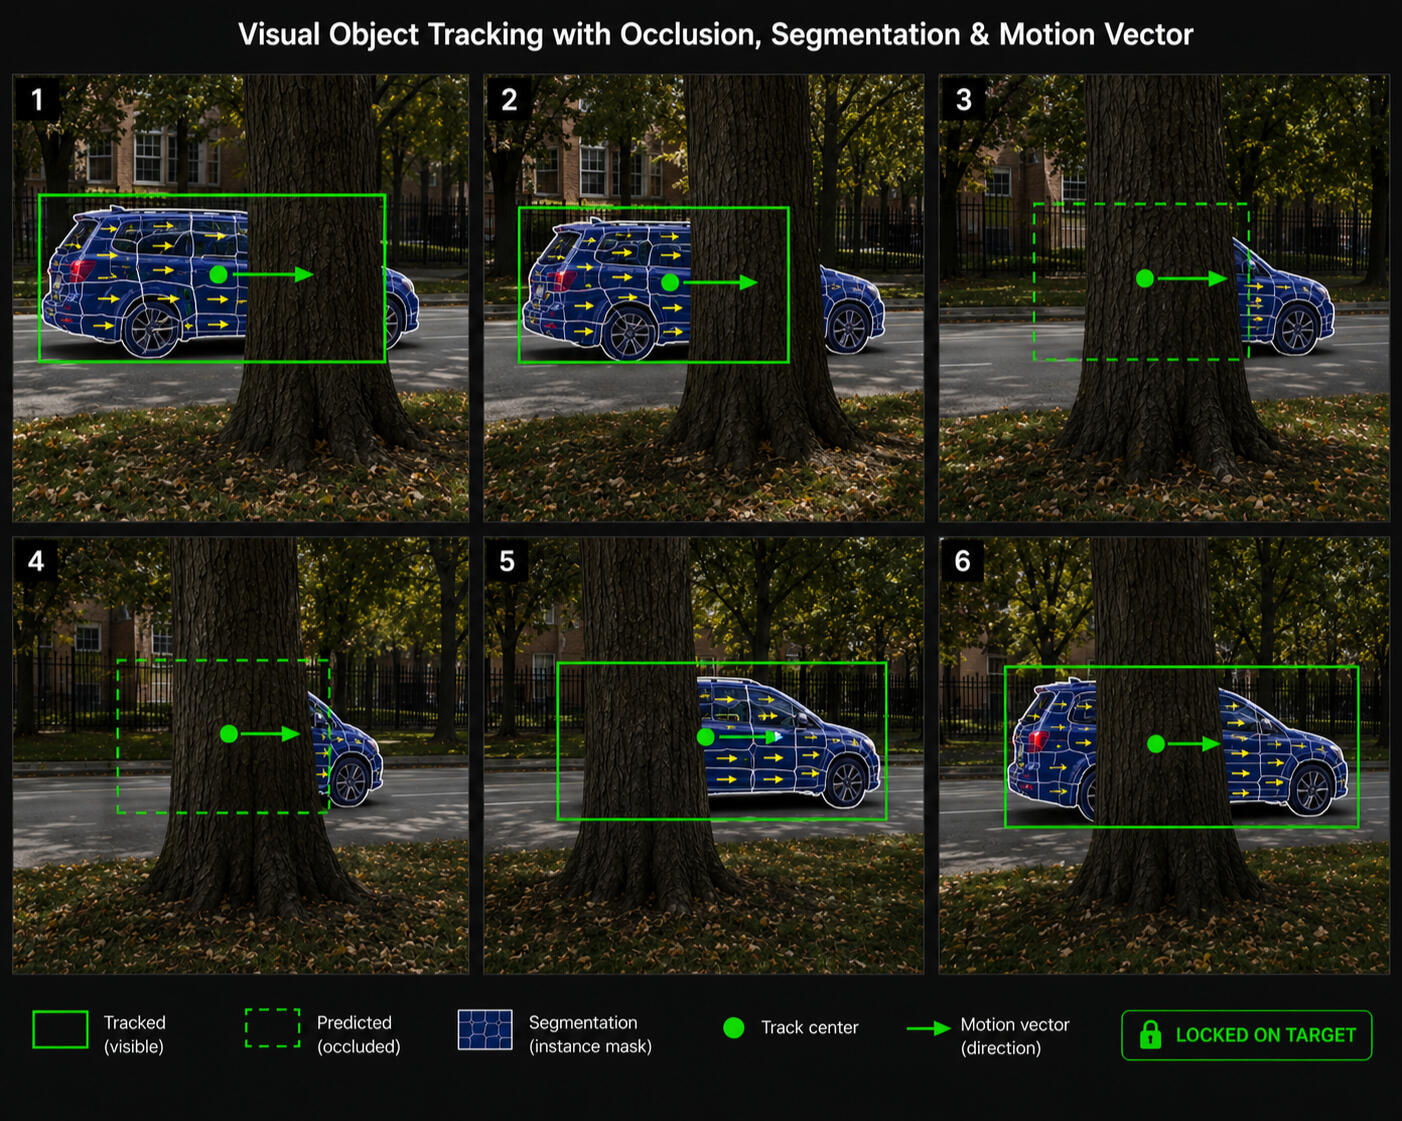
Human vision naturally interprets and understands the surrounding world as a three-dimensional (3D) environment. In contrast, most common visual sensors, such as cameras, still capture only two-dimensional (2D) projections of this world. During the projection from 3D to 2D, a significant amount of information, particularly depth information, is lost.
While humans can effortlessly interpret the dynamic structure of 2D image sequences, achieving comparable understanding computationally is challenging, especially when relying on a single visual sensor. Although multiple sensors can facilitate 3D reconstruction, many multimedia applications rely on a single-sensor setup, making the absence of explicit 3D information one of the fundamental challenges in computer vision.
Consequently, the effective use of spatial and temporal cues becomes essential for understanding the dynamic structure of scenes captured with a single camera.
In much of my below public research, I rely on graph-based data structures and their associated algorithms, including breadth-first search (BFS), depth-first search (DFS), graph contraction, minimum spanning tree (MST), and finding the k shortest paths between two vertices, to obtain efficient implementations.
This provides a set of related constructive algorithms for high-level processing with linear, almost-linear, and polynomial time complexity. Linear or almost-linear time-complexity algorithms are proportional to the image size n.
This enables polynomial time complexity for some algorithms when the complexity is proportional to the number of arcs E in the image segmentation boundaries. Then the complexity becomes O(E × E) rather than O(N × N), where E << N.
A useful starting point for understanding artificial intelligence is the K-means algorithm, a classical unsupervised machine-learning method that groups data points into k clusters according to similarity. Each data point is assigned to the cluster whose centroid is closest, and each centroid is then updated as the mean of the points assigned to it. This assignment-and-update procedure is repeated until the cluster memberships stabilize.
Although K-means is conceptually simple, it captures a fundamental computational principle: complex data can be organized into structured groups by iteratively refining an internal representation. It is useful in applications such as customer segmentation, image analysis, and visual-data organization. Its limitations are also important: the number of clusters must be specified in advance, and the method is most effective when the underlying clusters are approximately spherical in Euclidean space.
Artificial intelligence systems learn statistical patterns from data and use those patterns to make predictions, classifications, decisions, or generative outputs. Modern deep neural networks extend this idea by optimizing large collections of parameters through iterative training. The model compares its predicted output with the desired output, computes an error, and updates its internal weights using gradient-based optimization methods such as backpropagation.
Conceptually, deep learning can be viewed as a broad generalization of the intuition embodied in K-means. While K-means partitions data in a relatively simple geometric space, neural networks learn high-dimensional feature spaces in which similar inputs are mapped to nearby regions and dissimilar inputs are separated. In this sense, AI systems perform a dynamic, learned, and highly expressive form of pattern organization, preserving the core idea of grouping similarity while expanding it toward abstraction, generalization, reasoning, and complex decision-making.
The conceptual link between K-means and modern AI is not that they are the same algorithm, but that both organize data by discovering structure. K-means does this explicitly through centroids; neural networks do it implicitly through learned features, internal layers, and optimized parameters.
Computer vision enables machines to interpret visual information: capturing an image, detecting objects, extracting patterns, and turning pixels into meaningful understanding.
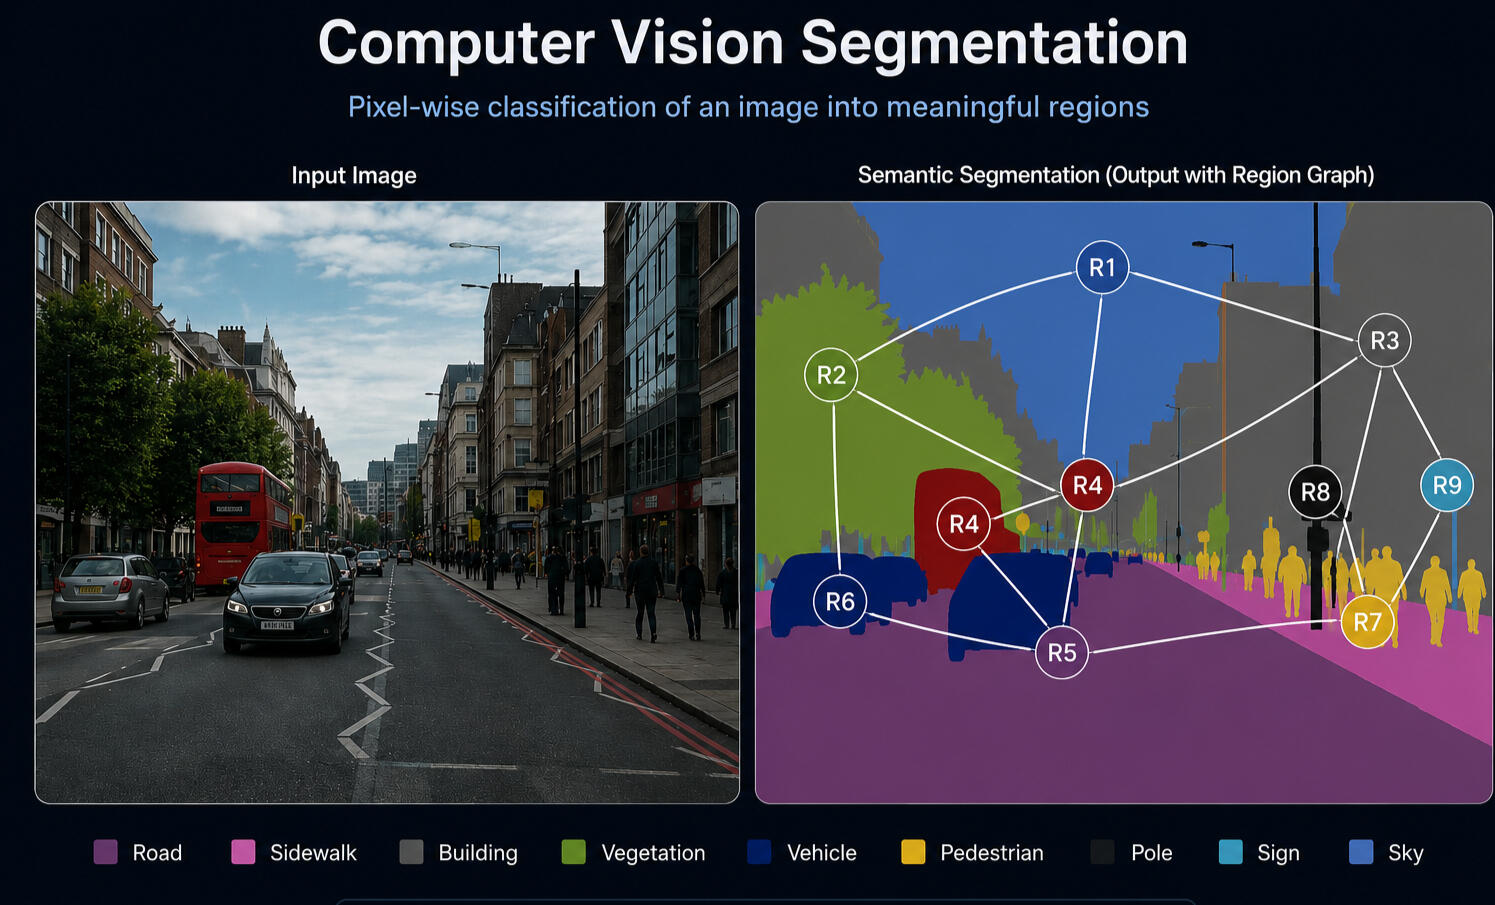
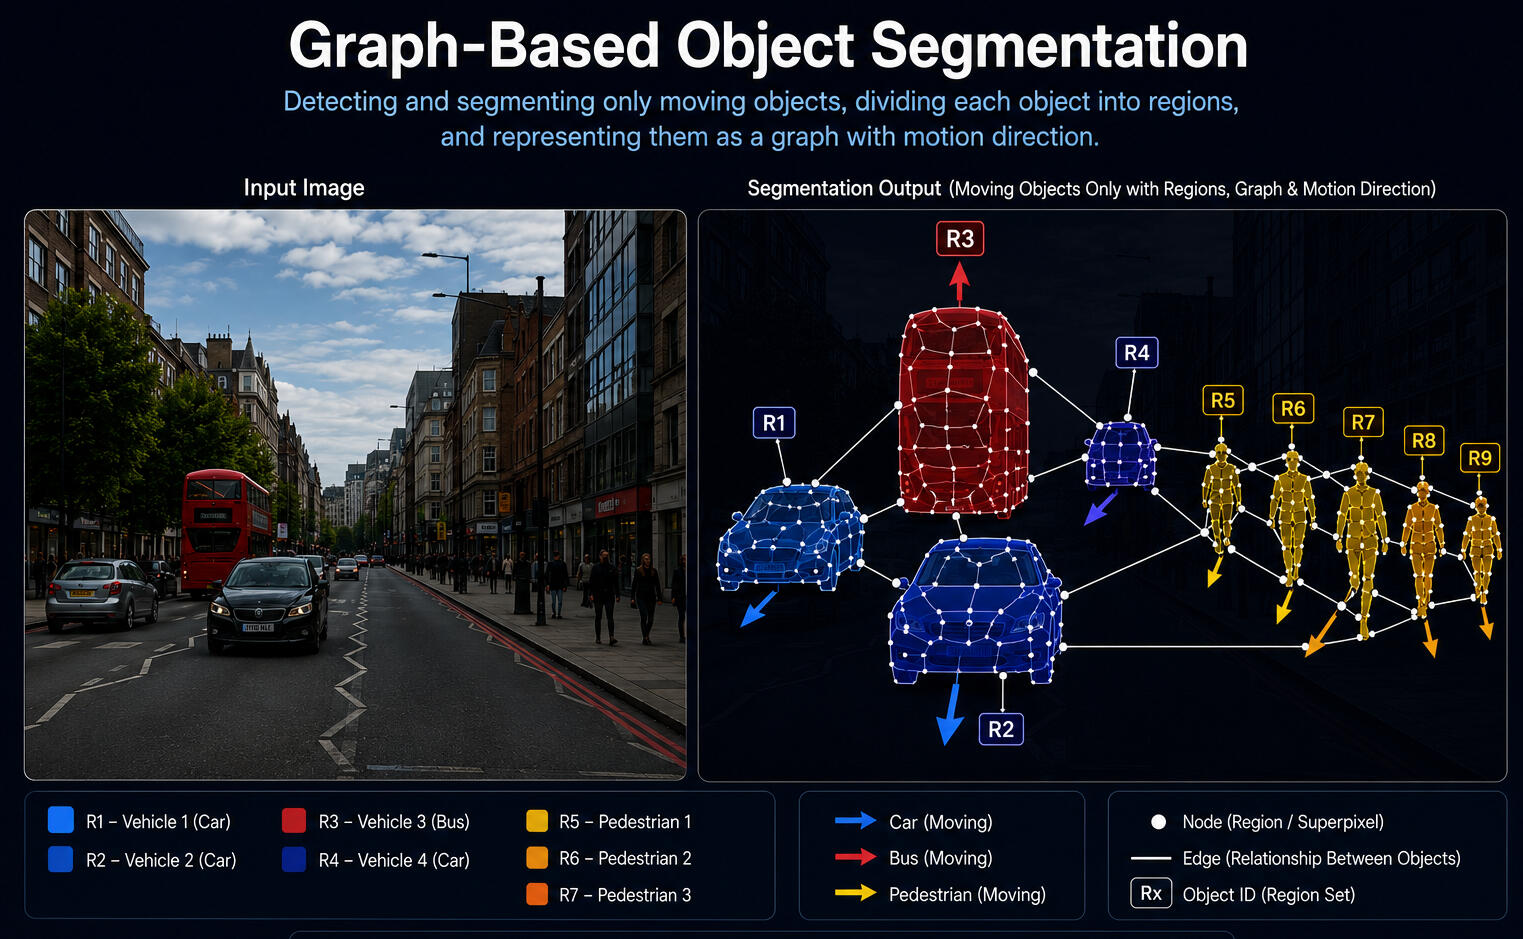
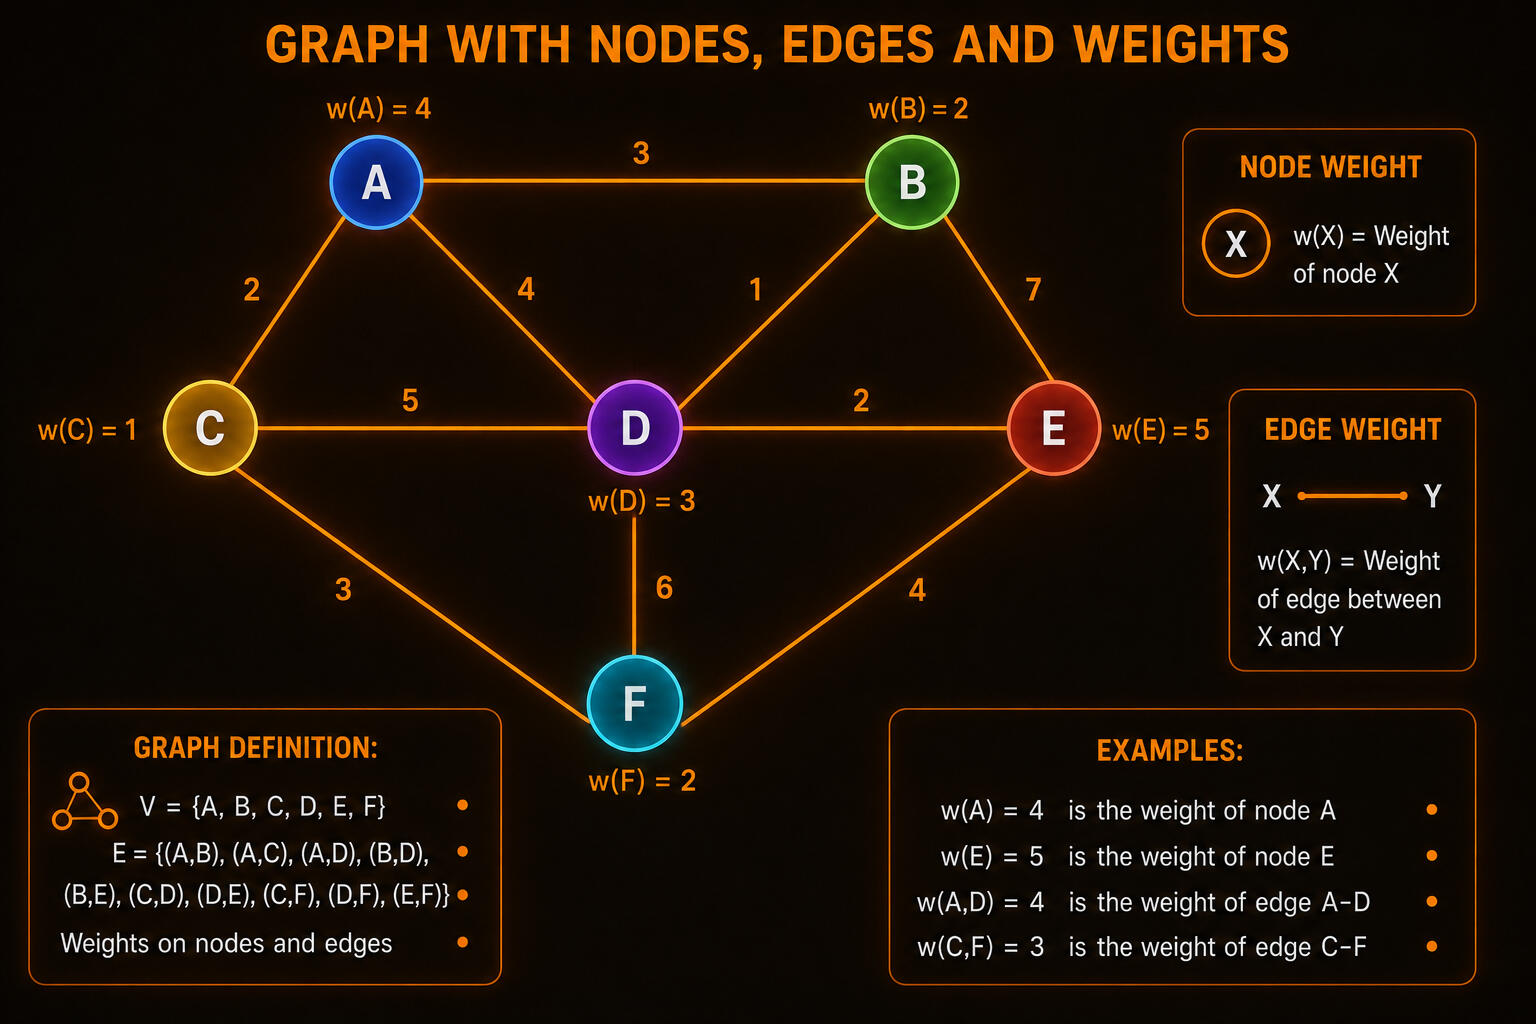
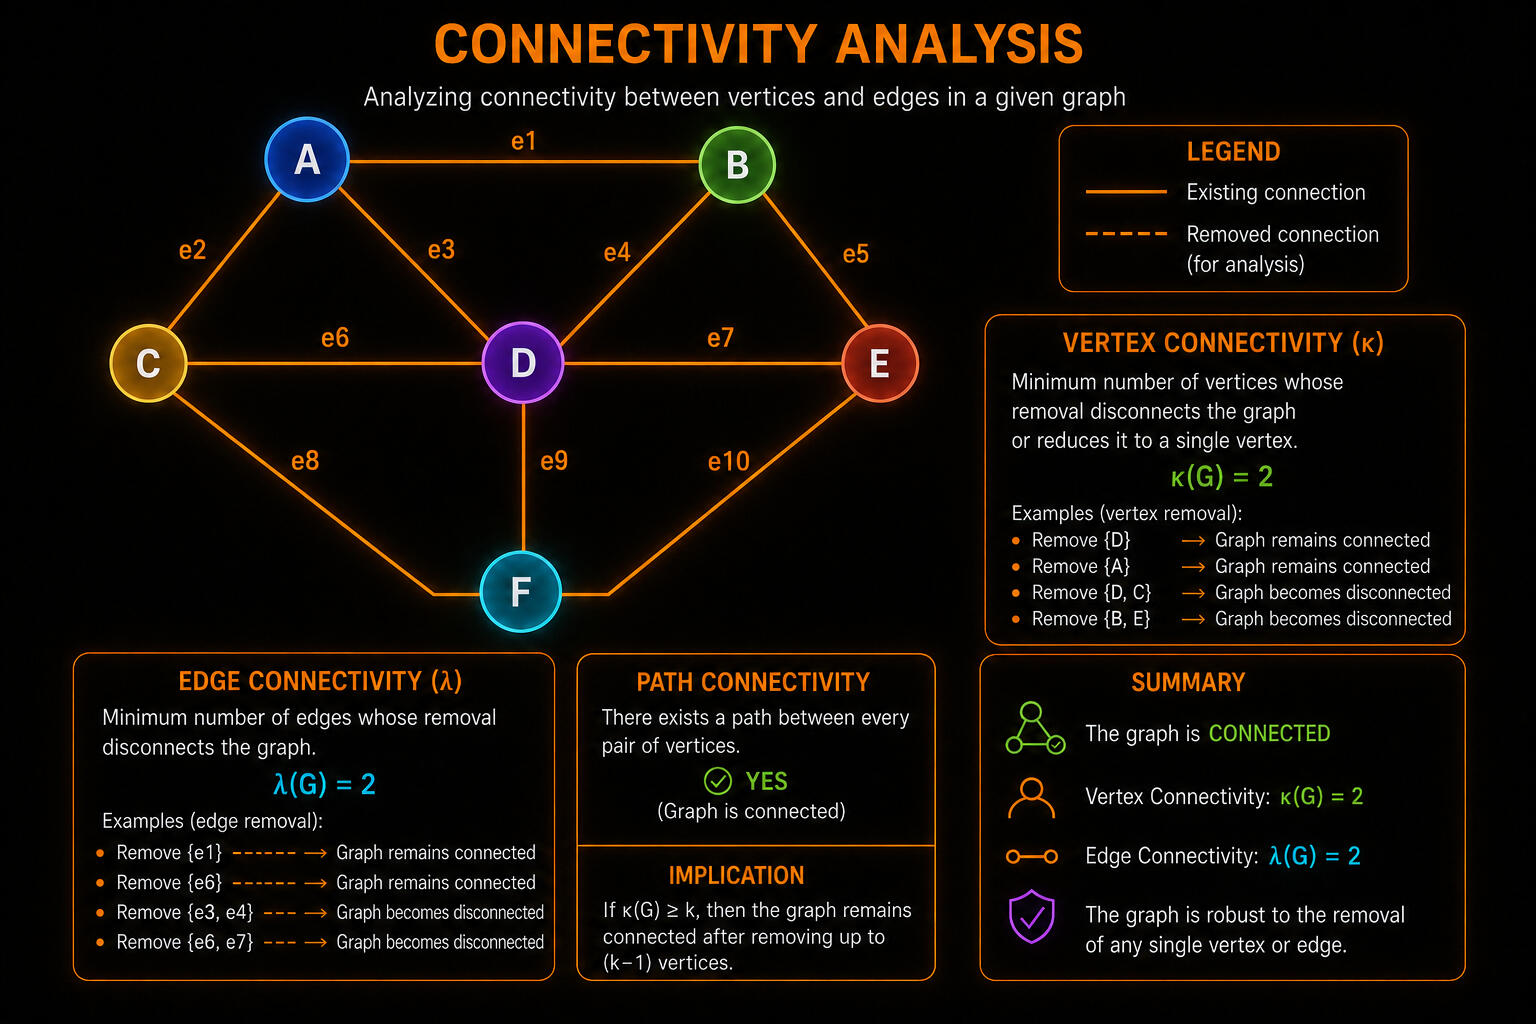
Graph theory studies networks made of nodes and connections. In computer vision, graphs can represent pixels, image regions, objects, relationships, motion paths, or visual structures.
Algorithm complexity uses mathematical expressions to describe how computation grows: running time, memory cost, recursive behavior, input size, and scalability.
Artificial intelligence can be visualized as information flowing through multiple graph-like dimensions. Each layer transforms the signal, detects patterns, and passes learned representations forward.
A graph-based vision model transforms visual data into structure: pixels become regions, regions become nodes, relationships become edges, and the resulting graph supports segmentation, recognition, and scene understanding.
A unified research pipeline: raw visual data is processed, transformed into structured representations, analyzed through computational complexity, passed through AI models, and finally converted into visual understanding.
Raw pixels are filtered, enhanced, denoised, and prepared for higher-level analysis.
Image regions, objects, or features become nodes, while visual relationships become edges.
Computation is evaluated for scalability, time growth, memory use, and efficient execution.
Signals flow through learned representations, extracting patterns and forming predictions.
The system detects, recognizes, segments, and understands the visual world.